*************************************************
The
EPICS_SSCAN class is designed to do the following:
The EPICS_SSCAN class presently only has a command line interface to control it. There is not yet a GUI to select a scan, select detectors to plot, etc. However, one goal of the EPICS_SSCAN class is to provide a basis for the development of tools to enhance and/or replace the existing scanSee IDL tools developed by Ben-Chin Cha. These older tools are based on IDL's direct graphics system. Much of the visualization functionality written in scanSee is now included in the new iTools system in a more unified, object-oriented framework. For off-line data viewing and preparation of publication-quality plots it is clear that the iTools are superior. However, it remains to be seen whether the performance of the iTools system will be sufficient for on-line data viewing as a scan is being collected.
Once a GUI is written for EPICS_SSCAN, then the entire package, including all of the iTools, can be saved as an IDL ".sav" file that can be run for free using the new IDL Virtual Machine. The Virtual Machine runs on virtually all platforms (Unix, Linux, Windows, Mac). This will provide a very nice tool for users to be able to visualize their data at home, without having to purchase IDL. To use the IDL command line, or to enhance the functionality of EPICS_SSCAN, it is necessary to have an IDL license.
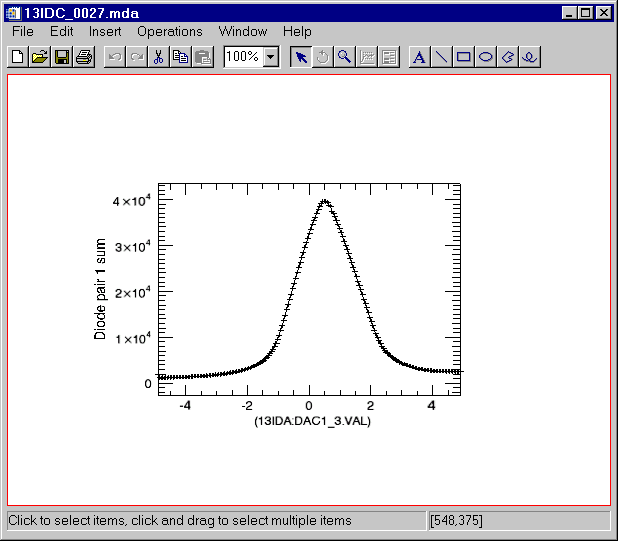
Read the 1-D dataset
IDL> s = read_mda('13IDC_0027.mda')Display the first detector.
IDL> s->display
This produces the following plot:

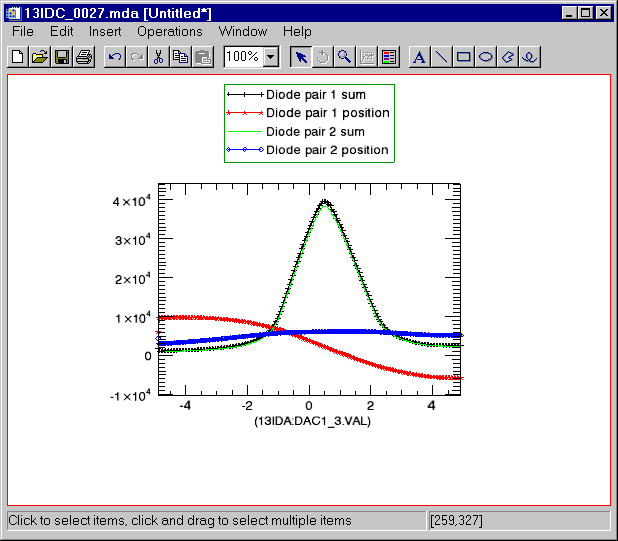
Now display all of the detectors on a single plot. (The legend was added manually by clicking in the dataspace and using Insert/Legend from the menu).
IDL> s->display, /all

Read the 2-D dataset
IDL> s=read_mda('2idd_0087.mda')Display all of the images in a grid. Note, this takes a minute or so, depending on computer speed, because it is displaying 47 images in the iImage tool.
IDL> s->display, /all, /grid
*************************************************
Let me know what you think. Is this something to pursue, i.e. put a GUI on top of this?
Cheers,
Mark
�